
Introduction
Beginning in FY2020, the F-33 survey added items tracking district
expenditures of temporary federal COVID-19 assistance funds (ESSER and
related programs). edfinr’s full dataset
carries these as the exp_covid_* variables, which let you
see how much pandemic aid districts reported spending, on what, and how
spending ramped up and began to decline from FY20-FY23.
The eight edfinr COVID expenditure variables map to F-33
items AE1-AE8 (see list_variables("full")):
-
exp_covid_total(AE1) – total expenditures from COVID-19 federal assistance funds. -
exp_covid_instr(AE2) – instructional expenditures. -
exp_covid_supp(AE3) – support services expenditures. -
exp_covid_cap_out(AE4) – capital outlay expenditures. -
exp_covid_tech_supp(AE5) – technology-related supplies and purchased services. -
exp_covid_tech_equip(AE6) – technology-related equipment. -
exp_covid_supp_plant(AE7) – operation and maintenance of plant (from FY2021). -
exp_covid_food(AE8) – food services operations (from FY2021).
Important caveats
-
Full dataset only. The
exp_covid_*variables are not in the skinny dataset; requestdataset_type = "full". -
Availability. AE1-AE6 begin in FY2020; AE7 and AE8
begin in FY21 (
first_yr_availin the dictionary records this). -
NAis not zero. Districts that did not report an item showNA, including districts whose raw F-33 values are zero-filled but flagged missing (FL_AE1 = "M"); edfinr converts those toNAduring cleaning. New York did not report these items, so its districts areNAin every year FY2020-FY2023, and roughly a third to half of California districts areNAfrom FY2021 onward. A0that survives cleaning is a genuine reported zero, which is common in FY2020 when most ESSER funds were not yet spent. Treat state-level comparisons with care. -
CPI adjustment applies. Like other expenditure
flows, the
exp_covid_*variables are scaled when you passcpi_adj. The examples below use nominal dollars to match how federal awards are usually described.
The arc of relief spending
covid <- get_finance_data(yr = "2020:2023", geo = "all", dataset_type = "full")

national <- covid |>
  filter(!is.na(exp_covid_total), !is.na(exp_cur_total)) |>
  group_by(year) |>
  summarize(
    covid_total = sum(exp_covid_total),
    cur_total = sum(exp_cur_total),
    enroll = sum(enroll, na.rm = TRUE),
    .groups = "drop"
  ) |>
  mutate(
    covid_pp = covid_total / enroll,
    covid_share = covid_total / cur_total
  )

national |>
  mutate(
    covid_total_b = round(covid_total / 1e9, 1),
    covid_pp = round(covid_pp),
    covid_share = round(100 * covid_share, 1)
  ) |>
  select(year, covid_total_b, covid_pp, covid_share)
## # A tibble: 4 × 4
## year covid_total_b covid_pp covid_share
## <int> <dbl> <dbl> <dbl>
## 1 2020 1.9 51 0.4
## 2 2021 22.7 532 4.1
## 3 2022 33.9 808 5.6
## 4 2023 35.7 819 5.3The table shows total reported COVID-fund spending (in billions), per-pupil spending, and COVID-fund spending as a share of current expenditure among districts reporting both items.
What did districts spend relief funds on?
component_labels <- c(
  exp_covid_instr = "Instruction",
  exp_covid_supp = "Support services",
  exp_covid_cap_out = "Capital outlay",
  exp_covid_tech_supp = "Technology supplies/services",
  exp_covid_tech_equip = "Technology equipment",
  exp_covid_supp_plant = "Plant operations",
  exp_covid_food = "Food services"
)

covid |>
  select(year, all_of(names(component_labels))) |>
  pivot_longer(-year, names_to = "component", values_to = "amount") |>
  filter(!is.na(amount)) |>
  group_by(year, component) |>
  summarize(total = sum(amount), .groups = "drop_last") |>
  mutate(share = total / sum(total)) |>
  ungroup() |>
  mutate(component = component_labels[component]) |>
  ggplot(aes(x = year, y = share, fill = component)) +
  geom_col() +
  scale_y_continuous(labels = scales::label_percent()) +
  labs(
    title = "Composition of Reported COVID-Fund Spending by Year",
    subtitle = "Shares of summed component items (AE2-AE8), nominal dollars",
    x = "Year", y = "Share of Component Spending", fill = "Component"
  ) +
  theme_minimal()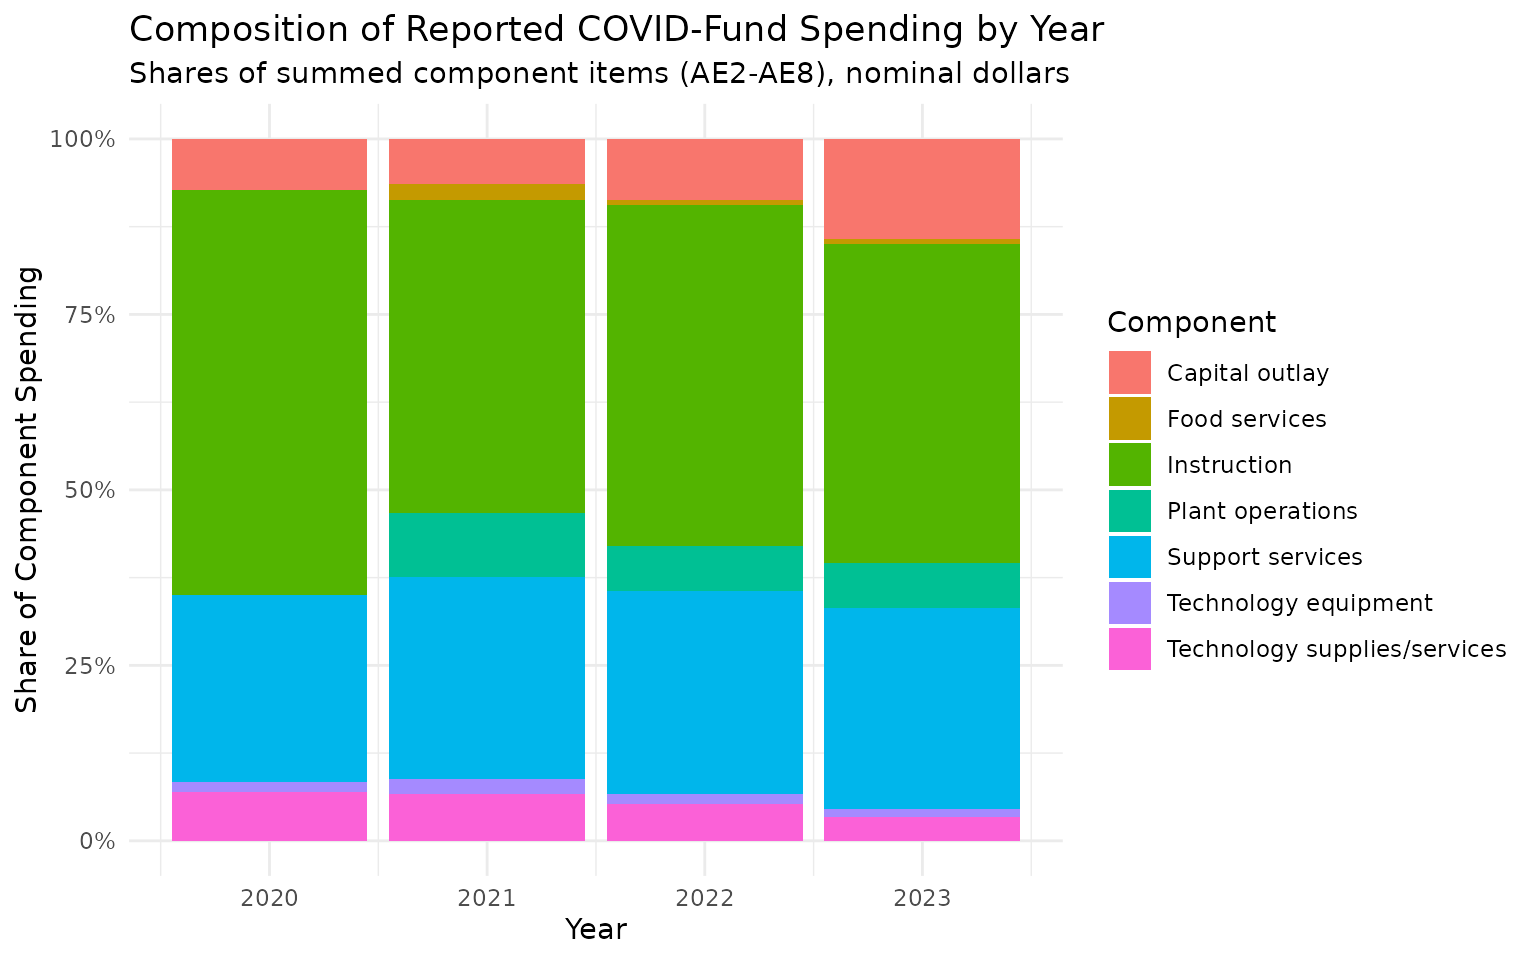
How did relief spending vary across districts?
covid |>
  filter(year == 2023, !is.na(exp_covid_total), enroll >= 200,
         !is.na(urbanicity)) |>
  mutate(covid_pp = exp_covid_total / enroll) |>
  ggplot(aes(x = urbanicity, y = covid_pp)) +
  geom_boxplot(outlier.alpha = 0.15) +
  scale_y_continuous(labels = scales::label_dollar()) +
  coord_cartesian(ylim = c(0, 5000)) +
  labs(
    title = "Per-Pupil COVID-Fund Spending by Urbanicity, FY2023",
    subtitle = "Districts with 200+ students; y-axis truncated at $5,000",
    x = "Urbanicity", y = "COVID-Fund Spending Per-Pupil"
  ) +
  theme_minimal()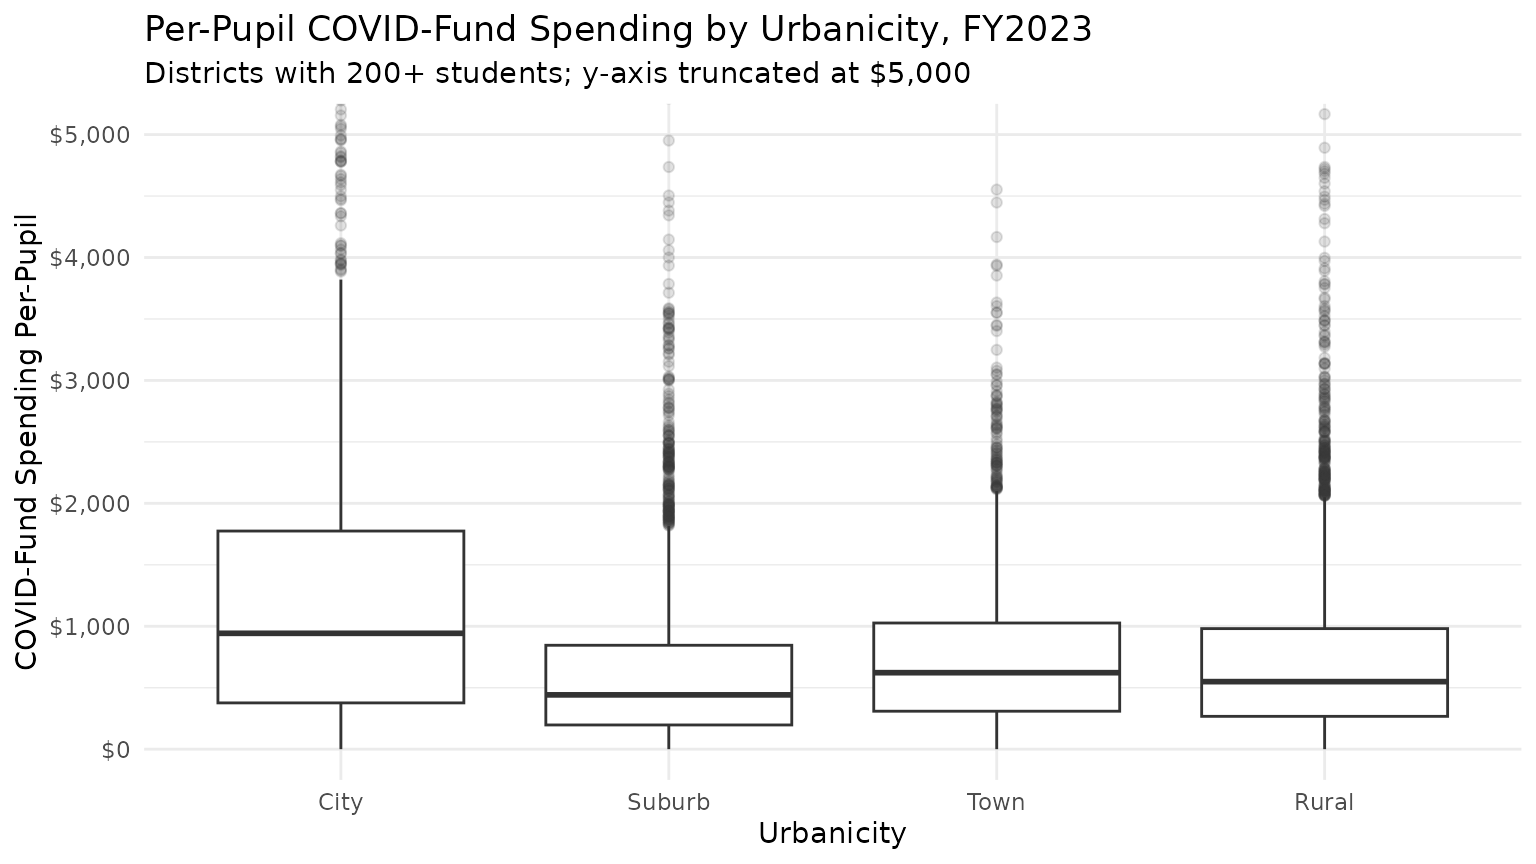
Tracking the wind-down in large districts
largest_ids <- covid |>
  filter(year == 2023) |>
  slice_max(enroll, n = 6) |>
  pull(ncesid)

covid |>
  filter(ncesid %in% largest_ids) |>
  mutate(
    dist_name = dist_name[which.max(year)],
    covid_pp = exp_covid_total / enroll,
    .by = ncesid
  ) |>
  ggplot(aes(x = year, y = covid_pp)) +
  geom_line() +
  geom_point(size = 1) +
  facet_wrap(~dist_name, ncol = 2) +
  scale_y_continuous(labels = scales::label_dollar()) +
  labs(
    title = "Per-Pupil COVID-Fund Spending in the Six Largest Districts",
    subtitle = "FY2020-FY2023, nominal dollars",
    x = "Year", y = "COVID-Fund Spending Per-Pupil"
  ) +
  theme_minimal()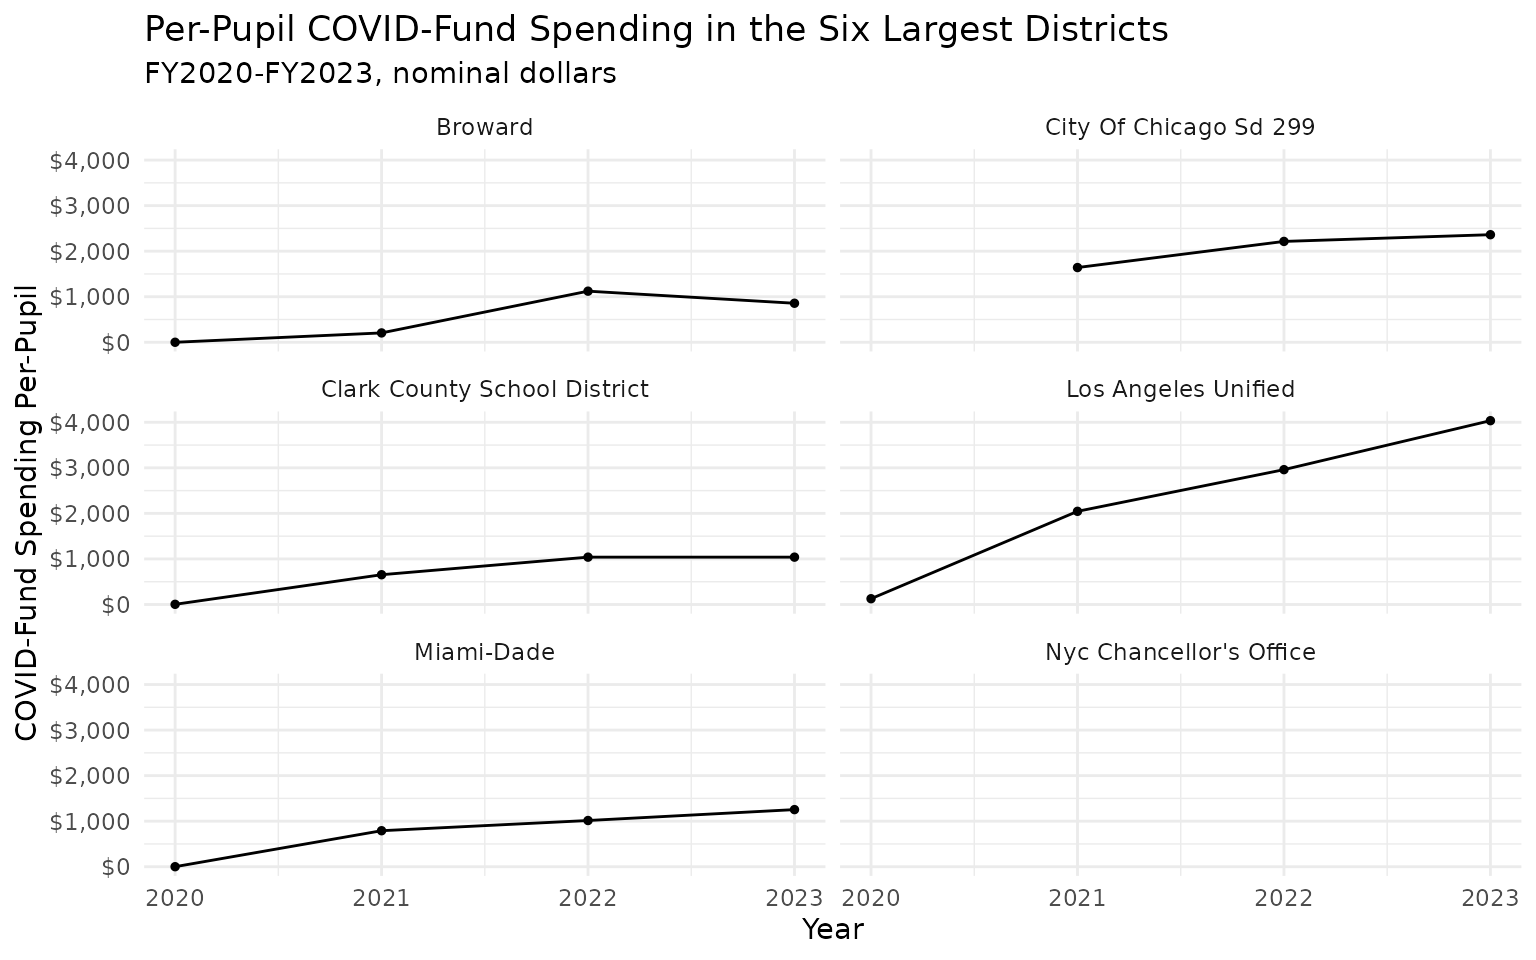
The empty New York City panel is the sharpest illustration of caveat
3’s warning: the nation’s largest district shows NA on
every AE item in all four years. The raw F-33 files carry those items as
zeros, but the accompanying data-item flags mark them missing
(FL_AE1 = "M") – New York State never reported the COVID
items for any of its districts – so edfinr labels them as
NA rather than letting billions of dollars in allocated
relief funds appear as zero spending. Before reading any single
district’s series, confirm the state actually reported these items in
the years you are comparing.